Introduction Associations between unhealthy food environments and increased risk of diabetes or obesity have been studied extensively in urban areas but less so in rural areas. To address this gap, we performed a geographically detailed study of the rural food environment, summarizing and assessing various measures and identifying their association with a higher rate of diabetes and obesity. Methods We surveyed 1,311 residents of Sullivan County, New York, collecting data on demographic characteristics and health status in January 2021.
What the research examined
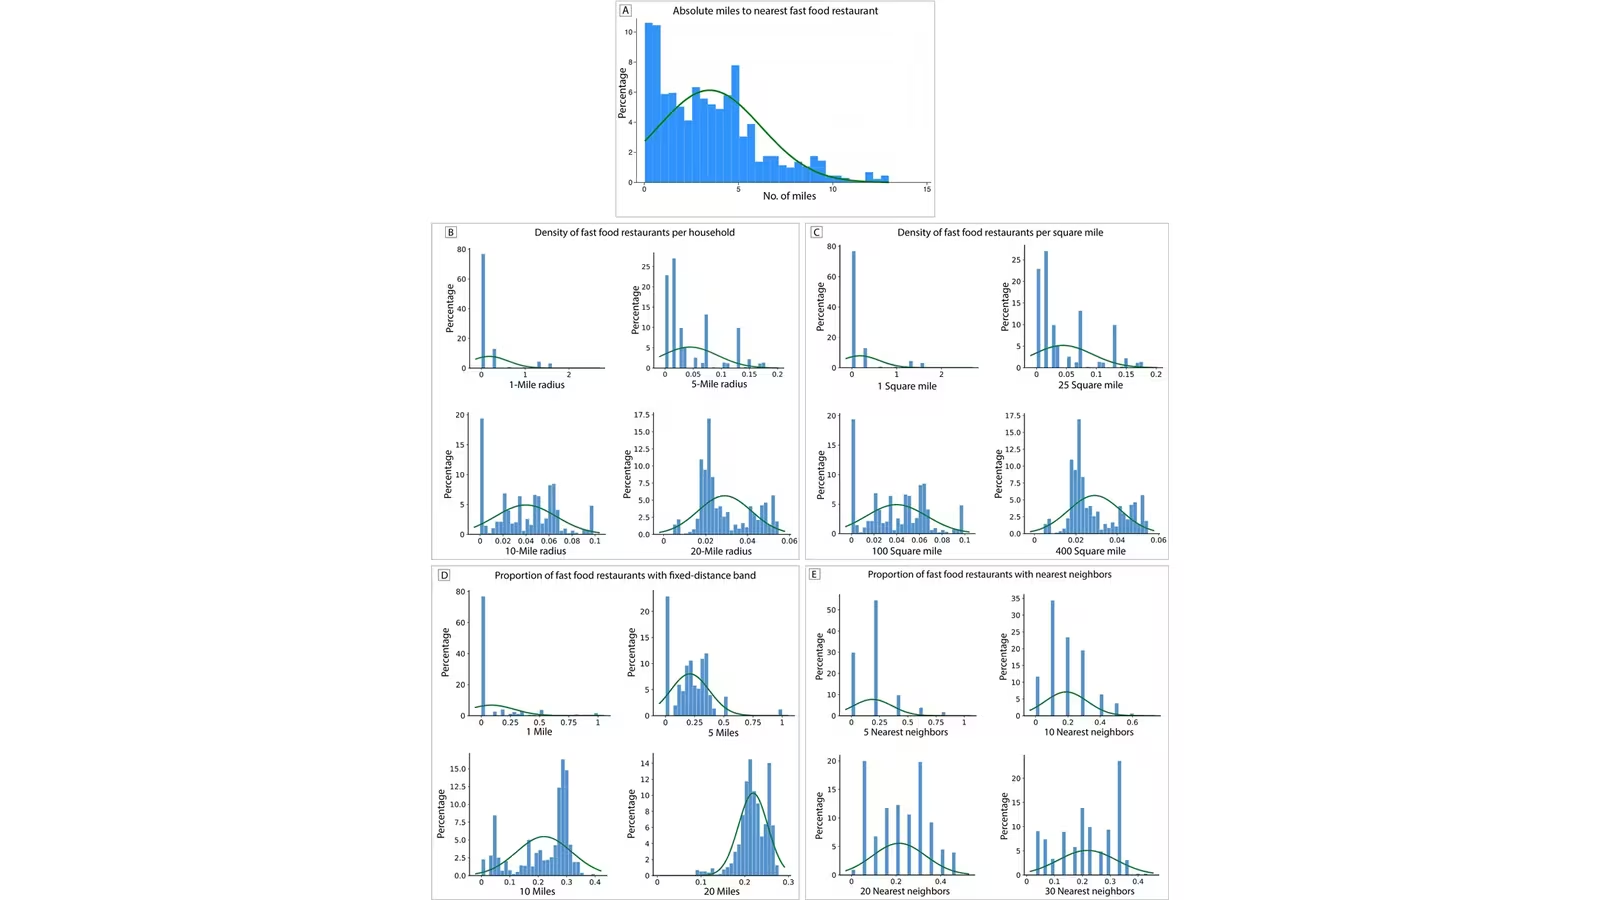
We assessed the food environment by cataloging restaurants and retail food stores and used least absolute shrinkage and selection operator (LASSO) regression to identify metrics strongly associated with diabetes and obesity (body mass index >30.0). We compared absolute proximity, density, relative proportions, and modified retail food environment index metrics. We applied fixed distance bands and nearest-neighbor approaches for proportions. Results Older age (LASSO = +0.276), nearest-neighbor proportion of fast food restaurants (LASSO = +0.155), and low income (LASSO = +0.150) were associated with higher diabetes rates.
What the findings mean
Nearest-neighbor proportion (LASSO = +0.269), density per square mile of groceries/supermarkets (LASSO = +0.247), and Hispanic ethnicity (LASSO = +0.181) were the strongest predictors of obesity. Nearest-neighbor metrics helped with the problem of frequent zeros: the least skewed measures were fast food restaurants with 20 nearest neighbors (P = .37 for skewness) and counter-service restaurants with 20 nearest neighbors (P = .81). Conclusion Nearest-neighbor approaches were less skewed to other metrics based on fixed distance bands, proximity, and density. Food environment metrics must be fully described and validated, especially in rural environments, before they are applied in research on critical health outcomes.
Study authors: Gjonaj J, Yi H, Flores TA, So C, Motola HL, Keita D, Moore J, Elbel B, Thorpe LE, Lee DC.. This report is based on the openly licensed abstract and source record and has been formatted for newsroom reading.
Preventing chronic disease
https://europepmc.org/articles/PMC13614342This report is prepared from the public source listed above for news and industry-information purposes. Original research, text, trademarks and images remain with their authors and rights holders; open material is used under the licence identified by its source. Rights holders may contact rights@asiafoodtimes.com with evidence of ownership, and verified concerns will be corrected or removed promptly. This article is not investment, legal, medical or nutrition advice.